Portal:Real Economy Project/More resources
Jump to navigation
Jump to search
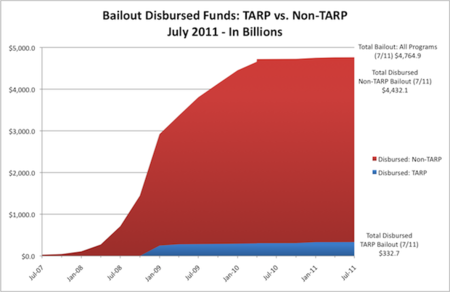
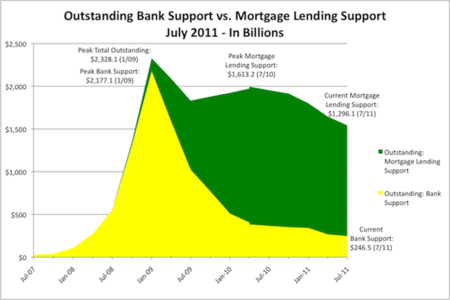
These graphs were produced by the Center for Media and Democracy. The first shows the TARP bailout, which was voted on by Congress in October 2008, compared to the backdoor (Non-TARP) bailout by the Federal Reserve, which was never subjected to a Congressional debate or a vote. The second chart shows that the vast majority of Federal Reserve money has gone to purchases of mortgage backed securities, a practice that was continuing into 2013. See more here.
CMD's Press Releases Related to the Bailout
- Money Still Owed In Federal Bailout, July 2011
- Taxpayers Still Out $2 Trillion, September 2010
- Homeowners Get No Help From TARP, July 2010
- Bubbles and Bailouts, June 2010
- Stealth Bailout Underway, May 2010
- Bailout Focus on Housing, April 16, 2010
- CMD Bailout Press Release, April 1, 2010
- Key Findings from CMD Bailout Report, April 1, 2010

